Linear Quadratic Regulator
Problem 1 - Linear Quadratic Regulator
Problem Statement:
Consider a tracking sensor which in steady state tracks an object. Let θ(t) be the angle (in radians) between the direction the sensor is pointing, and the direction of the object being tracked. If the sensor loses the track (i.e., θ(t) ≠ 0), in the absence of any feedback control to return the sensor to the object, the sensor will reorient itself to a given reference orientation. Assume this behavior may be modeled using:
θ_nc (t+1)= 1.2*θ_nc (t).
where “nc” means “no control.”
We want to build a Linear Quadradic Regulator (LQR) that will optimally return the system to tracking an object given it has lost track. Note: the control input provides the correction required to bring the sensor back into track (e.g., from a Kalman Filter).

MATLAB Code: problem_1.m
Author: Yash Bansod
Date: 2nd May, 2020
Problem 1 - Linear Quadratic Regulator
GitHub: https://github.com/YashBansod
Clear the environment and the command line
clear;
close all;
clc;
Define the input parameters
init_theta = 0.05;
delta_t = 1;                     % Delta time
num_steps = 61;                     % Number of time steps (including t=0)

R = 1;
Q = 3;
LQR computations
theta = zeros(1, num_steps);
theta_nc = zeros(1, num_steps);
u = zeros(1, num_steps);
K = zeros(1, num_steps);
P = zeros(1, num_steps);

A = 1.2;
B = 1;

theta(1) = init_theta;
theta_nc(1) = init_theta;
P(end) = Q;

for t_step = num_steps:-delta_t:2
    P(t_step - 1) = Q + (A * P(t_step) * A') - (A' * P(t_step) * B * ...
        inv(R + B' * P(t_step) * B) * B' * P(t_step) * A);
end


for t_step = 1:delta_t:num_steps-1
    K(t_step) = -inv(R + B' * P(t_step + 1) * B) *  B' * P(t_step + 1) * A;
    u(t_step) = K(t_step) * theta(t_step);
    theta(t_step + 1) = A * theta(t_step) + B * u(t_step);
    theta_nc(t_step + 1) = A * theta_nc(t_step);
end
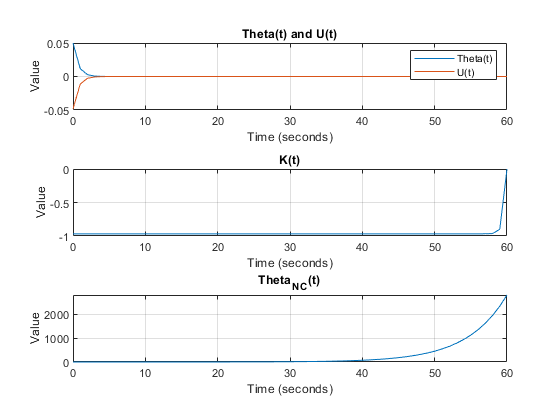
Plot the results
time_line = 0:delta_t:(num_steps - 1)* delta_t;

figure(1);

subplot(3, 1, 1)
plot(time_line, theta);
hold on;
grid on;
plot(time_line, u);
title('Theta(t) and U(t)');
xlabel('Time (seconds)');
ylabel('Value');
legend('Theta(t)', 'U(t)')

subplot(3, 1, 2)
plot(time_line, K);
grid on;
title('K(t)');
xlabel('Time (seconds)');
ylabel('Value');

subplot(3, 1, 3)
plot(time_line, theta_nc);
grid on;
title('Theta_N_C(t)');
xlabel('Time (seconds)');
ylabel('Value');